
Trading cards portfolio
Introduction
For some of us who collect or still collect trading cards, it is common to wonder how much our cards are worth. To answer this question, we often look at pricing data from websites such as eBay. However, there are many different platforms to observe prices.
In this project, I focused on cardmarket, a highly specialized popular offer-sided platform that acts as an e-marketplace for trading cards of all sorts. cardmarket enables sellers (private and commercial) to offer cards worldwide and process the transaction via the platform. Prices are formed on cardmarket exclusively on the basis of the supply side, which means that the price of a card is determined by the number of sellers offering it and the prices they are asking. I own some old Japanese Pokémon trading cards that are not often traded in Europe due to demand. The platform is suitable for me because all of my cards are also listed in their Japanese version.
Web scraping
cardmarket offered a public API in past years, but the Berlin-located company decided to restrict access to business sellers only. So rather, instead of retrieving data by API, web scraping was my way to go. For that purpose, Python was used to implement some functionality that retrieves the current state of website data on a daily basis. Therefore, focus relied on price and market data offered by the platform.
- Prices: Obtaining price values from overview table provided by cardmarket’s calculations (such as min and daily prices, weekly avg, …)
- Market: Market table that contains seller information of their corresponding offerings (amount of cards, seller’s country, ratings, expected determined by the seller)
- Cards: Excel table that was created by myself (contains name, rareness, set name, amount of specific card, respective url to cardmarket page, etc.)
Daily scraping is realized by crontab on my personal Debian notebook. At 12am, the scripts for extraction and composition of market and prices data are executed. The execution time can be adjusted easily and if necessary, done more often or less often. For some of my observed cards, prices won’t change for like weeks or months and for others will occur daily.
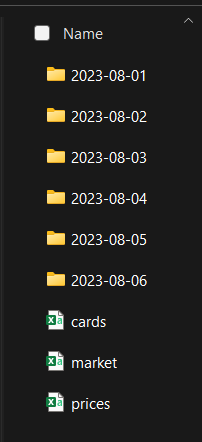
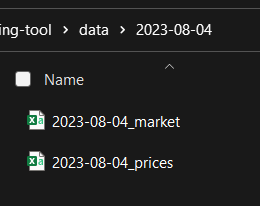
collect_prices.py, collect_market.py are two scripts that I coded to scrap data for prices and markets. After extraction, the said tables are saved as data frames in CSV format by day. At the end, collect_data.py will append new entries from the current day to collection files.
Data transformation
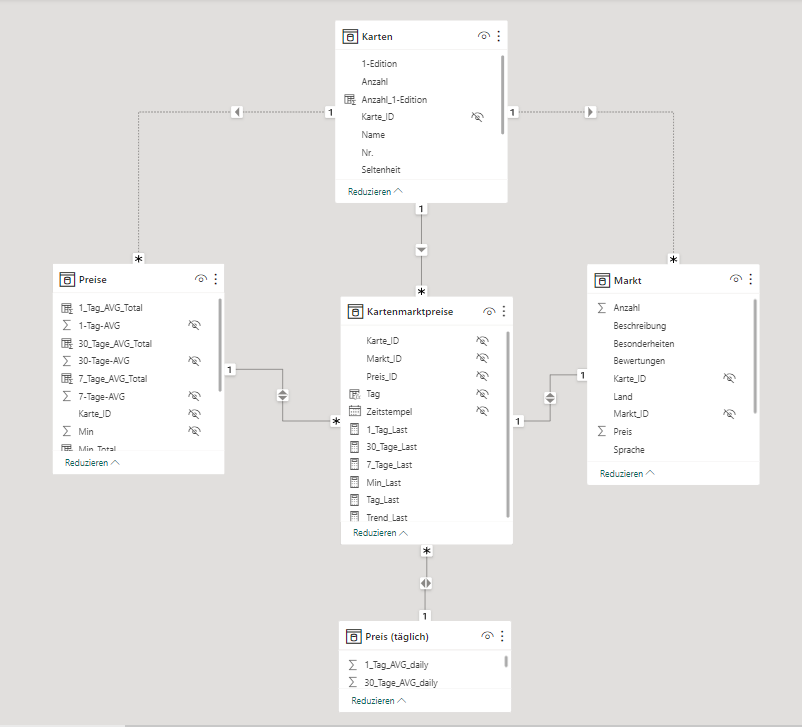
A fact table for trading cards portfolio is always generated by a Python script by using the primary keys to merge all three data frames. Market, Pricing and Card-Table contain UUID identifier that allow these tables to later join on.
To get the price values by days right, a new table was created (lower table in the figure) containing every available date with respective price information. This was done by taking the amount of cards into account.
In case of market data, it became necessary to filter out some parts of the HTML source code to obtain seller’s country, comments for offerings, etc. Extracting the market data was the most time-consuming and effort-intensive part of the entire project.
For calculation purposes, I added some dummy variables like is_1st_edition. To retrieve values like the no. of 1st edition cards, I multiplied columns by quantity of existing cards in my collection.
In the end, some relationships between tables in Power BI were manually corrected so that cross filtering works flawlessly. To enter the step of visualization, I waited to have at least one month of market and price data to be able to better estimate the results displayed in the dashboard and to counteract errors during the extraction.
Some difficulties occurred during transformation, including: wrong file encode format resulting in wrong float conversions, cross filter direction messed up and changes were made to the scraping scripts, which caused the collection files to become inconsistent.
Dashboard
Star schema helps to easily understand and analyze large amounts of data. It makes the database structured and organized so that we can find information quickly. Every daily data set contains approx. two thousand rows of market entries. Therefore, considering the increasing amount of data and the query times required, star schema is a great addition.
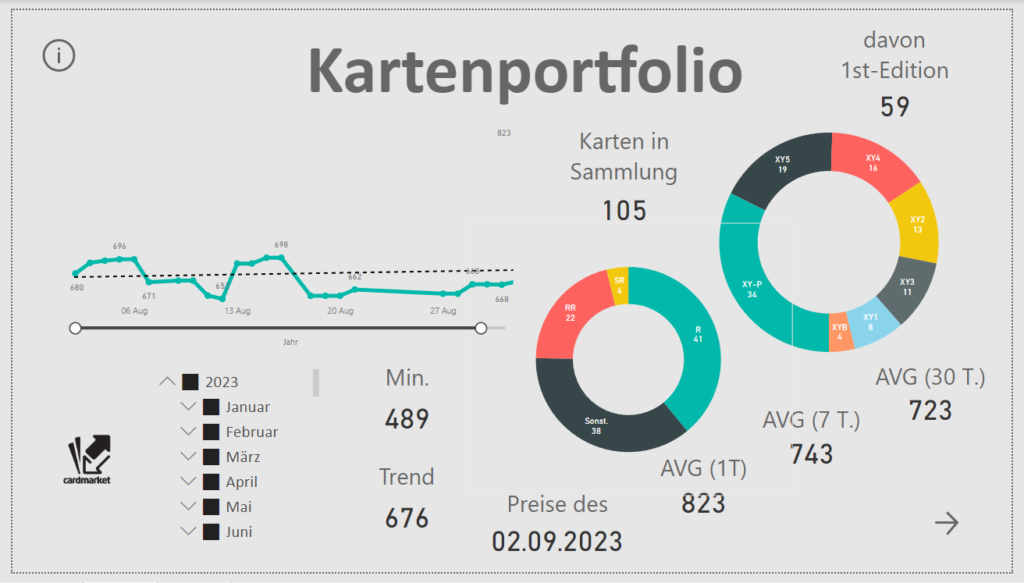
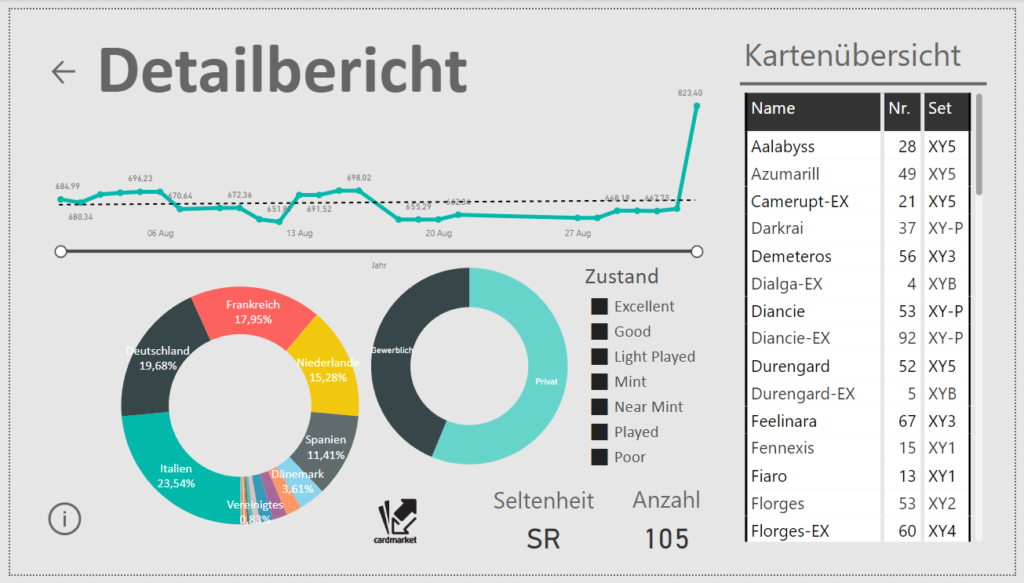
Prices can be filtered by: Time, Card Set, Rarity, Country and Seller Type (Private/Commercial), and Specific Cards. Dashboard is split into two frames: general and card view. General view contains all relevant information about portfolio value in total, value changes over time and giving me a sense of knowing the cards better. For quick research on evaluation, this was the idea of my dashboard. If I needed some more detailed information why price jumps occur, I can switch to detailed card level view, which allows me to follow price trends for every listed card in my portfolio individually. Because this is not often necessary in reality, I added some information about seller’s distribution to understand where cards are located, because this can impact prices on some local markets as well.
Hierarchies have only proven to be useful in a few cases and have been implemented in time and cards (category, set) dimension tables.
Outlook
Fair enough, just by looking at cardmarket prices we don’t get the most precise forecast on card portfolios. As seeable in a detailed report, if some sellers just decide to go for unreasonable high prices at which they won’t be able to sell their cards, dashboard is still affected by outliers. But still, this is how the data looks like. Instead of changing, it would be better to add data from other existing marketplaces.
In the data transformation phase, it would also be interesting to see how to develop a predictive model using the historical price data to try to predict the price trend. This would be even more interesting if I actually planned to sell parts of my card collection at a certain point in time.
While creating the dashboard, I sometimes ran into the limitations of visualization in Power BI. In particular, some chart types turned out to be too sparse and not very flexible in terms of labels (like pie chart). It would be interesting to see if a dashboard with more design options could be implemented with Tableau, for example. After all, there is a Tableau version for students that can be used free of charge.
Dashboard overview
Resources
- Technologies used: Python, Beautiful Soup library, Power BI for Visualization
- Source code for cardmarket Scraping Tool available on Gitlab
- Gupta, Mayank: Web Scraping With Python Using Beautiful Soup
- Abiodun, Sodiq: The Importance of Star Schema in Power BI